Simple shapes#
In this notebook we will exercise the imageruler algorithm with some simple shapes.
import numpy as np

from imageruler import imageruler
from matplotlib import pyplot as plt

# Import functions that generate regular shapes.
from imageruler.regular_shapes import disc, rounded_square, stripe
Examples based on regular 2d shapes are as follows.
resolution = 1  # number of pixels per unit length
phys_size = (200, 200)  # physical size of the entire image
declared_mls = 50  # declared minimum length scale

image = rounded_square(
    resolution, phys_size, declared_mls, angle=20
)  # generate a rounded square

plt.figure()
plt.imshow(image)
plt.show()

solid_mls, _ = imageruler.minimum_length_scale(
    image
)  # estimate the minimum length scale of the solid region
print("Declared minimum length scale of the solid region: ", declared_mls)
print("Estimated minimum length scale of the solid region: ", solid_mls)
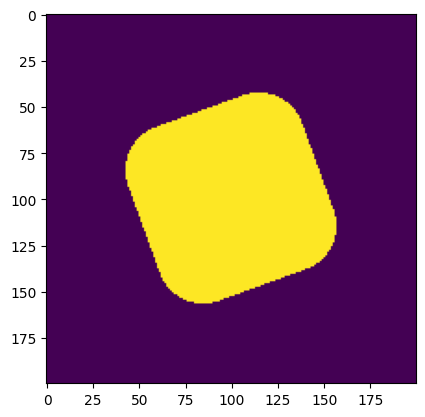
Declared minimum length scale of the solid region:  50
Estimated minimum length scale of the solid region:  49
diameter = 50
image = disc(resolution, phys_size, diameter)  # generate a disc

plt.figure()
plt.imshow(image)
plt.show()

# estimate the minimum length scale of the solid region
solid_mls = imageruler.minimum_length_scale_solid(image)
print("Declared minimum length scale of the solid region: ", diameter)
print("Estimated minimum length scale of the solid region: ", solid_mls)
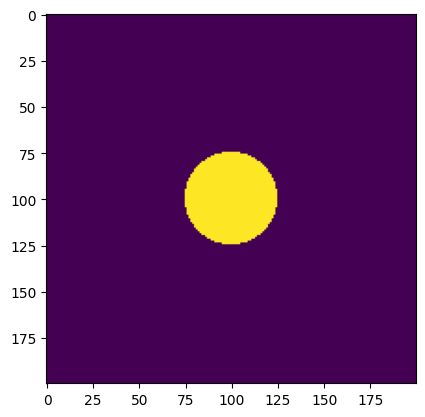
Declared minimum length scale of the solid region:  50
Estimated minimum length scale of the solid region:  50
outer_diameter, inner_diameter = 120, 50
declared_solid_mls, declared_void_mls = (
    outer_diameter - inner_diameter
) / 2, inner_diameter

solid_disc = disc(resolution, phys_size, diameter=outer_diameter)
void_disc = disc(resolution, phys_size, diameter=inner_diameter)
image = solid_disc ^ void_disc  # ring

plt.figure()
plt.imshow(image)
plt.show()

solid_mls, void_mls = imageruler.minimum_length_scale(image)
mls = min(solid_mls, void_mls)

print(
    f"Declared minimum length scale: {declared_solid_mls} (solid), "
    f"{declared_void_mls} (void)"
)
print(
    f"Estimated minimum length scale: {solid_mls} (solid), {void_mls} "
    f"(void), {mls} (minimum)"
)
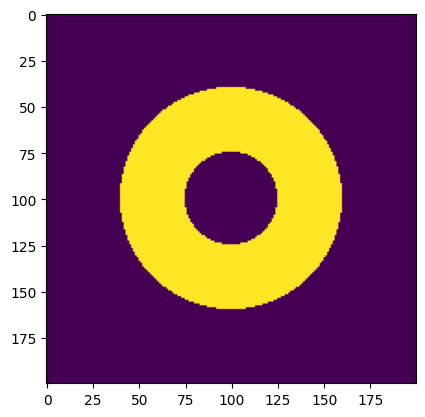
Declared minimum length scale: 35.0 (solid), 50 (void)
Estimated minimum length scale: 34 (solid), 50 (void), 34 (minimum)
resolution = 1  # number of pixels per unit length
phys_size = (400, 400)  # physical size of the entire image

outer_diameter, middle_diameter, inner_diameter = 300, 200, 100
declared_solid_mls, declared_void_mls = (
    outer_diameter - inner_diameter
) / 2, inner_diameter

outer_solid_disc = disc(resolution, phys_size, diameter=outer_diameter, center=(0, 0))
void_disc = disc(resolution, phys_size, diameter=middle_diameter, center=(-20, 0))
inner_solid_disc = disc(resolution, phys_size, diameter=inner_diameter, center=(-10, 0))
image = outer_solid_disc ^ void_disc ^ inner_solid_disc

plt.figure()
plt.imshow(image)
plt.show()

solid_mls, void_mls = imageruler.minimum_length_scale(image)
mls = min(solid_mls, void_mls)

print(f"Declared minimum length scale: {30} (solid), {40} (void)")
print(
    f"Estimated minimum length scale: {solid_mls} (solid), {void_mls} "
    f"(void), {mls} (minimum)"
)
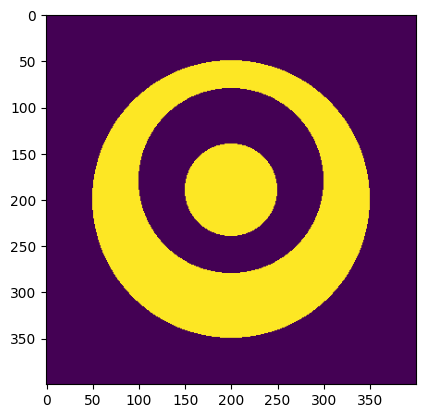
Declared minimum length scale: 30 (solid), 40 (void)
Estimated minimum length scale: 30 (solid), 40 (void), 30 (minimum)
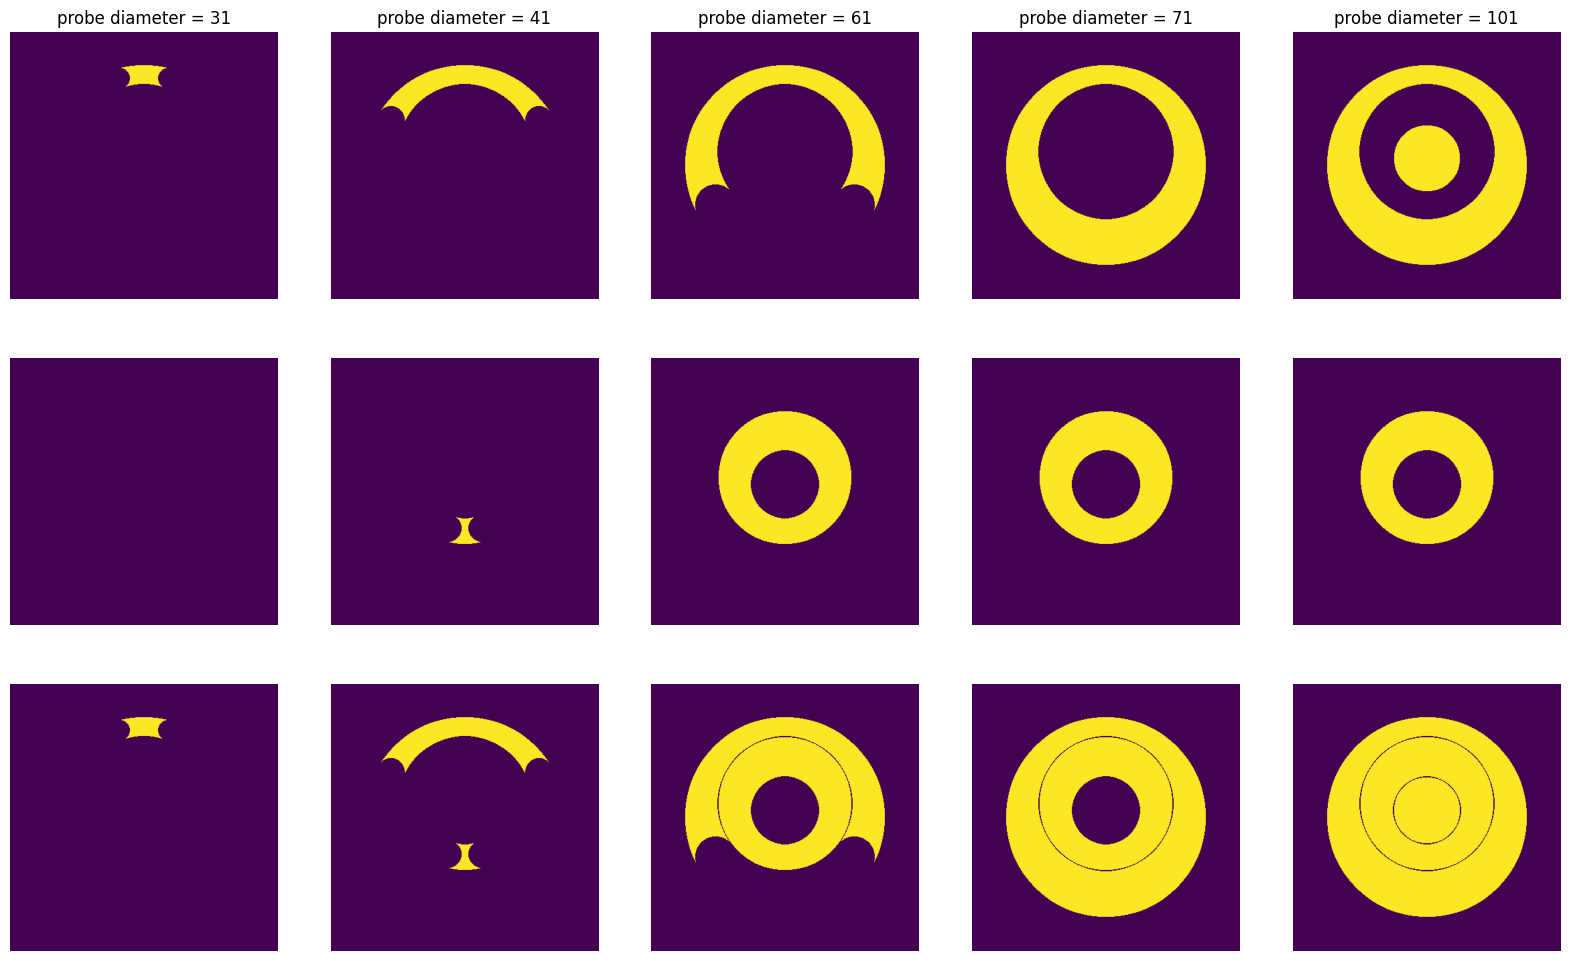
The images that illustrate the areas of violation at various probe diameters are shown as follows. The three rows from top to bottom show violations at solid, void, and either region.
diameters = [31, 41, 61, 71, 101]
nd = len(diameters)
plt.figure(figsize=(20, 12))

for idx in range(nd):
    plt.subplot(3, nd, idx + 1)
    ax = plt.gca()
    ax.set_axis_off()
    image_violation_solid = imageruler.length_scale_violations_solid(
        image, length_scale=diameters[idx]
    )
    plt.imshow(image_violation_solid)
    plt.title("probe diameter = " + str(diameters[idx]))

    plt.subplot(3, nd, nd + idx + 1)
    ax = plt.gca()
    ax.set_axis_off()
    image_violation_void = imageruler.length_scale_violations_solid(
        ~image, length_scale=diameters[idx]
    )
    plt.imshow(image_violation_void)

    plt.subplot(3, nd, 2 * nd + idx + 1)
    ax = plt.gca()
    ax.set_axis_off()
    image_violation = image_violation_solid | image_violation_void
    plt.imshow(image_violation)
resolution = 50
width, height = 6, 4  # size of the binary image
phys_size = (width, height)

stripe_width = 0.8
image = stripe(resolution, phys_size, stripe_width)

plt.figure()
plt.imshow(
    image,
    extent=[-phys_size[1] / 2, phys_size[1] / 2, -phys_size[0] / 2, phys_size[0] / 2],
)
plt.show()

solid_mls = imageruler.minimum_length_scale_solid(image)

print(f"Declared minimum length scale of the solid region: {stripe_width}")
print(f"Estimated minimum length scale of the solid region: {solid_mls / resolution}")
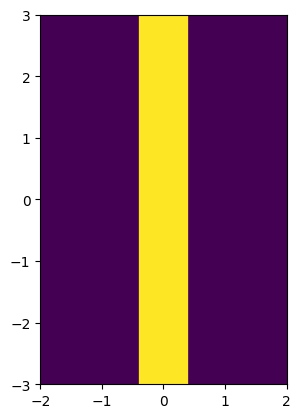
Declared minimum length scale of the solid region: 0.8
Estimated minimum length scale of the solid region: 0.8
image = stripe(resolution, phys_size, stripe_width, center=(0, -2)) | stripe(
    resolution, phys_size, stripe_width, center=(0, 2)
)

plt.figure()
plt.imshow(
    image,
    extent=[-phys_size[1] / 2, phys_size[1] / 2, -phys_size[0] / 2, phys_size[0] / 2],
)
plt.show()

# Assume this image is periodic along the horizontal direction, which corresponds to the axis 1.
solid_mls = imageruler.minimum_length_scale_solid(image, periodic=(False, True))

print(f"Declared minimum length scale of the solid region: {stripe_width}")
print(f"Estimated minimum length scale of the solid region: {solid_mls / resolution}")
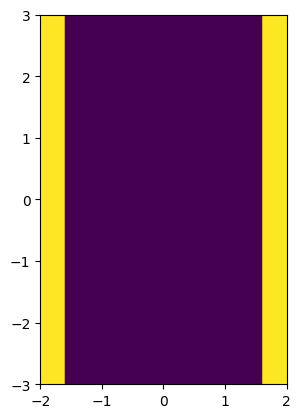
Declared minimum length scale of the solid region: 0.8
Estimated minimum length scale of the solid region: 0.8
stripe_width, intercept, angle = 1, 1 / np.sqrt(2), 0.25 * np.pi
image = stripe(resolution, phys_size, stripe_width, center=(intercept, 0), angle=135)

plt.figure()
plt.imshow(
    image,
    extent=[-phys_size[1] / 2, phys_size[1] / 2, -phys_size[0] / 2, phys_size[0] / 2],
)
plt.show()

solid_mls = imageruler.minimum_length_scale_solid(image)

print(f"Declared minimum length scale of the solid region: {stripe_width}")
print(f"Estimated minimum length scale of the solid region: {solid_mls / resolution}")
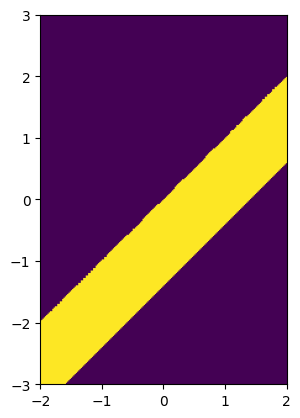
Declared minimum length scale of the solid region: 1
Estimated minimum length scale of the solid region: 0.98
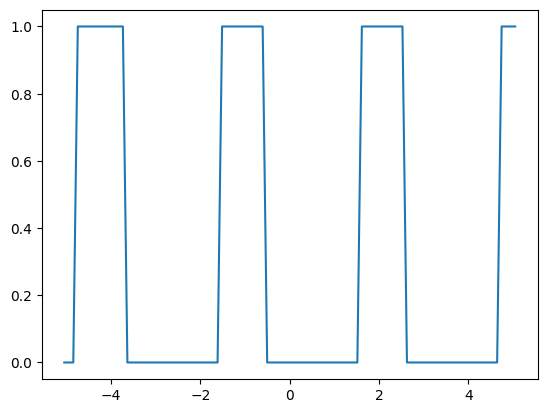
Some tests based on 1d images are as follows.
phys_size = 10.1
image = np.sin(np.linspace(0, 100, 101) / 5) > 0.5
image = image[:, np.newaxis]
resolution = image.size / phys_size

plt.plot(np.linspace(-phys_size / 2, phys_size / 2, len(image)), image)

solid_mls, void_mls = imageruler.minimum_length_scale(image, periodic=(True, True))
print(
    f"Estimated minimum length scales: {solid_mls / resolution} (solid), "
    f"{void_mls / resolution} (void)"
)

# disregard the short void and solid regions at both ends
solid_mls, void_mls = imageruler.minimum_length_scale(image)
print(
    f"Estimated minimum length scales with some end regions disregarded: "
    f"{solid_mls / resolution} (solid), {void_mls / resolution} (void)"
)
Estimated minimum length scales: 0.4 (solid), 0.3 (void)
Estimated minimum length scales with some end regions disregarded: 1.0 (solid), 2.1 (void)
This package can also be used via the command line, which allows you to invoke the function minimimum_length_scale. The syntax is “imageruler file”, where “file” is a string of the path of the text file that contains the array of the input image. All other arguments of the function take default options.
